 |
 |
| Press release Persbericht | Nieuw | Projects | Embedded WebServers | Testing | About Bromsmurf | Download | Links | WEBsite, Birds view |
BromSmurf Development |
||||
For more of BromSmurfs development and the engineering of the new milkmeter electronics see also: BromSmurfs secrets or Development of milkmeter electronics |
||||
A new prototyping board is born |
||||
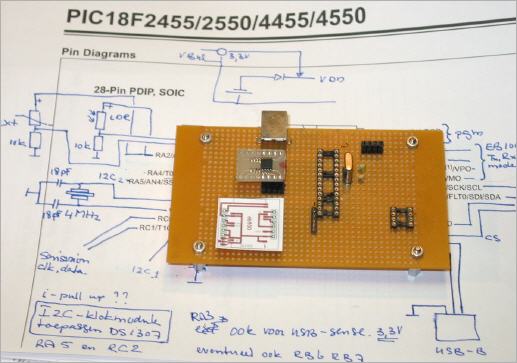
Prototyping board for Datamax II The printed paper circuit is developed in close cooperation with Franz. Main improvements over version I are connection through USB and the addition of wireless communication. Printed circuit added below. |
||||
Printed circuit born |
||||
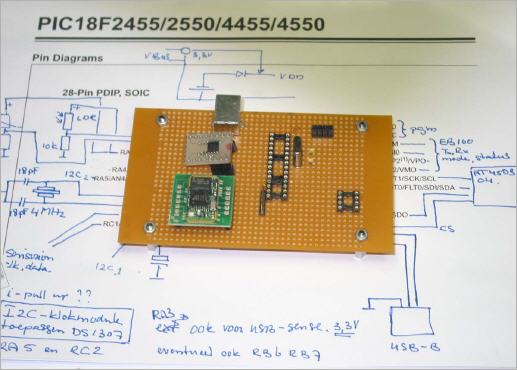
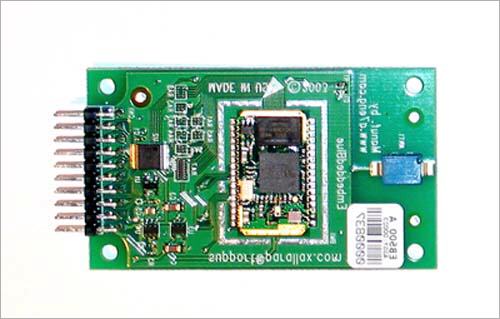
The green element is the new printed circuit developed in close cooperation with Achatz Electronics. It can be used in prototyping and testing environments for BlueTooth communication equipment. Placement is easy with a two row pin header. |
||||
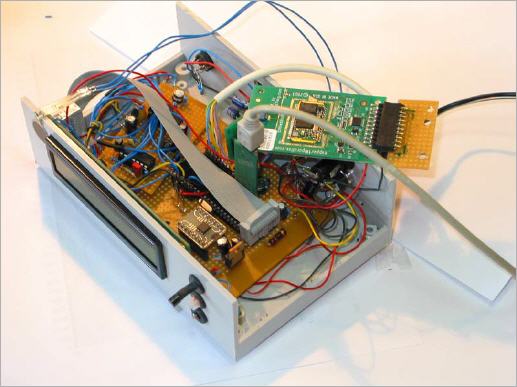
Experimental prototype for new DataMax |
||||
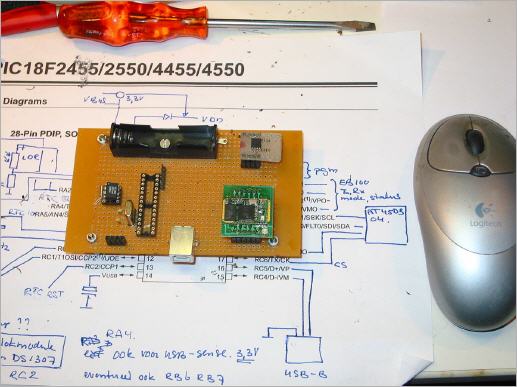
Prototype with most components and an engineering sketch |
||||
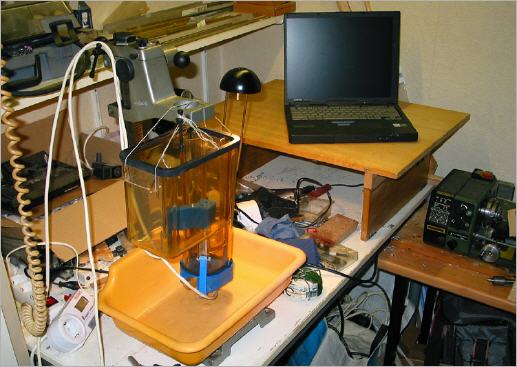
Bromsmurfs new MilkLab |
||||
Animated view of a Milkmeter [7.468 KB]
|
||||
Krokus data fit most spreadsheets |
||||
The data produced by the Krokus Dataloggers can be used in most spreadsheet programs. |
||||
Krokus A/B Research Model |
||||
Krokus A/B, dual use Research Model This is a fully functional Krokus A and a Krokus B in one system. It is used to test the functional part of the setup and to develop de Datalogging and Dataviewing firmware and PC-software. From this point a printed cicuit can be developed for SMD and/or through hole component mounting. A full SMD design can reduce the size of the PCB considerably. The functionality of the components will stay the same so the development of firmware and software can be carried out on either board without problems. |
||||
Signal conditioner, typical setup |
||||
Rail to rail operational amplifier Used as a signal conditioner in Krokus Datalogger applications |
||||
Structure of a Krokus instrument |
||||
A Krokus instrument is built from the following components: |
||||
Processor Krokus |
||||
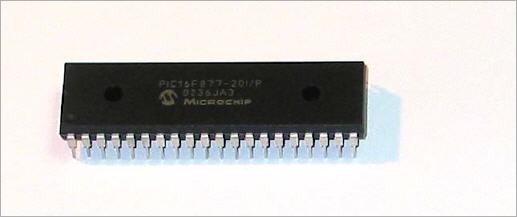
This chip is the hart of the Krokus system |
||||
EEPROM memory |
||||
Memory module, can be expanded if needed |
||||
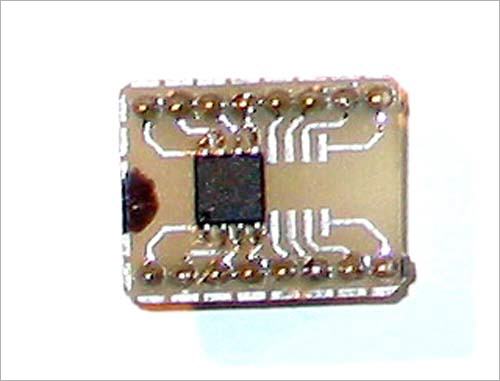
Communication with Krokus B |
||||
Bluetooth module for Krokus B |
||||
Communication Krokus B toPC |
||||
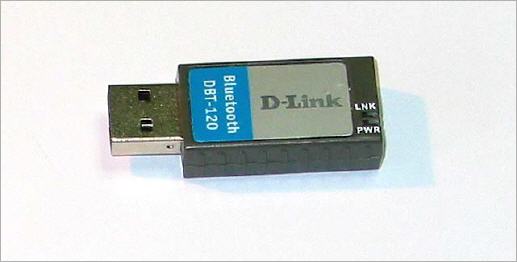
USB Bluetooth adapter for PC |
||||
Krokus instruments |
||||
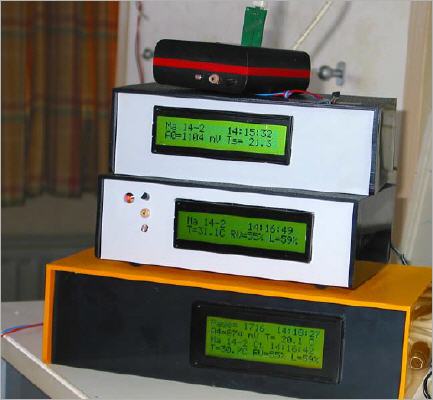
These are instruments of the Krokus family From top to bottom: -Krokus Datamini, miniature datalogging instrument. -Krokus Datalogger, powerfull datalogging instrument. -Krokus Remote Sensor, wireless measuring instrument. -Krokus main instrument and control center, a precision Datalogger and a wireless hub for Krokus Remote Sensors. |
||||
Krokus development |
||||
Below is an example of the kind of code the Dataloggers are filled with: |
||||
Latest news (This was in the beginning of 2005 :-) |
||||
The krokus Datalogger has performed a 10 day continuous and unattended testrun errorfree and with excellent results. |
||||
10 day continuous and unattended testrun. |
||||
Weather station and Krokus Datalogger merged |
||||
The Krokus Dataloggers and the weather station are now tied together to display graphics simultaneously. |
||||
Krokus A in 24 hour testrun |
||||
The Krokus A has successfully completed a 24 hour unattended testrun. It produced the graph below. |
||||
|
||||
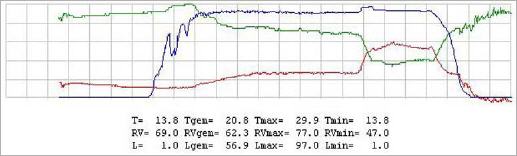
First 24 hour continuous test with Krokus A The values in this graph show the cycles of night and day. Light goes up in the morning and in the evening it gets dark :-). Temperature and RH react verry distinctive when in the afternoon the sun shines through te window. |
||||